30 Day Map Challenge 2020
A collection of awesome maps from Twitter.
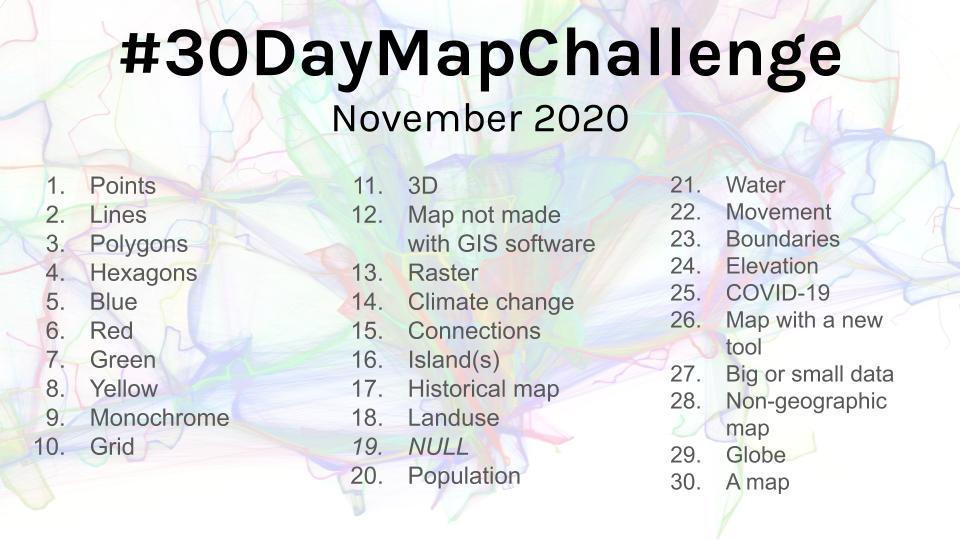
In 2019 Topi Tjukanov sparked a lot of interest when he announced the #30DayMapChalleng on Twitter (see my 2019 gallery) that he decided to run it again in November 2020: https://github.com/tjukanovt/30DayMapChallenge
I've managed to record all the maps from the Twitter firehose for posterity. There are so many awesome creations from many talented people around the world that it's a shame not to be able to go back and look through them for inspiration.
Where are the maps?
Click through to the map gallery where you can explore all* the maps. Turning the unstructured data of thousands of tweets (map submissions and random discussion) into a structured dataset is naturally a long and partly manual process, so the gallery content continues to grow.
The interface allows you to filter by challenge days and the areas being mapped, as well as other metadata - the types of maps and the tools used (where they've so far been classified). Click on a map card to see the full image, and to link through to the original tweet and the creator's webpage.
As you might expect, loading the full page and looking at every map in detail will load 10s or 100s of MB of data, but the images are loaded lazily so you don't have to download it all at once!
How many people took part? What were the most popular countries?
Take a look at the stats page (though it needs a bit more data at this stage).
There is far too much for me to get through in a timely fashion, so I'm hoping to draw on the wonders of crowdsourcing. Speaking of which...
Can I help complete the metadata for the maps?
I'm so glad you asked! The easiest option is probably to this Google spreadsheet and I'll manually incorporate your changes.
Unlike last year, I had the foresight to create a spearate git repository for the metadata: https://github.com/dakvid/30DayMapChallenge2020Metadata which means that people can clone just the text files without the 100s of MB of map images. That's the best place for a pull request if you're so inclined. You can also drop me an email (myname at frigge.nz) or tweet if you prefer.
I think I'm managing to keep up with harvesting the tweeets, so if a map is missing from the gallery then it should be in my todo list (actually a todo data frame) and will appear soon. The most helpful area to crowdsource is the metadata on areas, topics, types and tools.
Note that I decided to only allow one map per theme/day per person. Some people made multiple maps for a theme - generally you can see the others if you click through to the original tweet.
Can I make my own?
Of course, you can use the metadata I've collated to create your own gallery or analysis - it would be great to see others' perspectives. Just don't forget to observe the challenge code of conduct.
Who are you?
I'm David Friggens (@dakvid) - just another guy on Twitter with an interest in maps. I have a number of other commitments in November so my map contributions are/will be light, but I'm looking forward to being inspired by everyone else.
How did you make this site?
With Bootstrap 4 and the Lux theme from Bootswatch. The gallery was made with shuffle.js and lazysizes. The data munging and HTML construction is performed by some rough R code.
I've made almost no changes to the code from the 2019 gallery, so the areas that could be done better aren't. But it still works, and that's the main thing!
Is a FAQ style the best way to structure this page?
No, probably not.