Blog Posts by David Friggens
Interatively Comparing Auckland's Population Against Other Regions
How many regions does it take to match Auckland's population? Here's an interactive to explore the combinations.
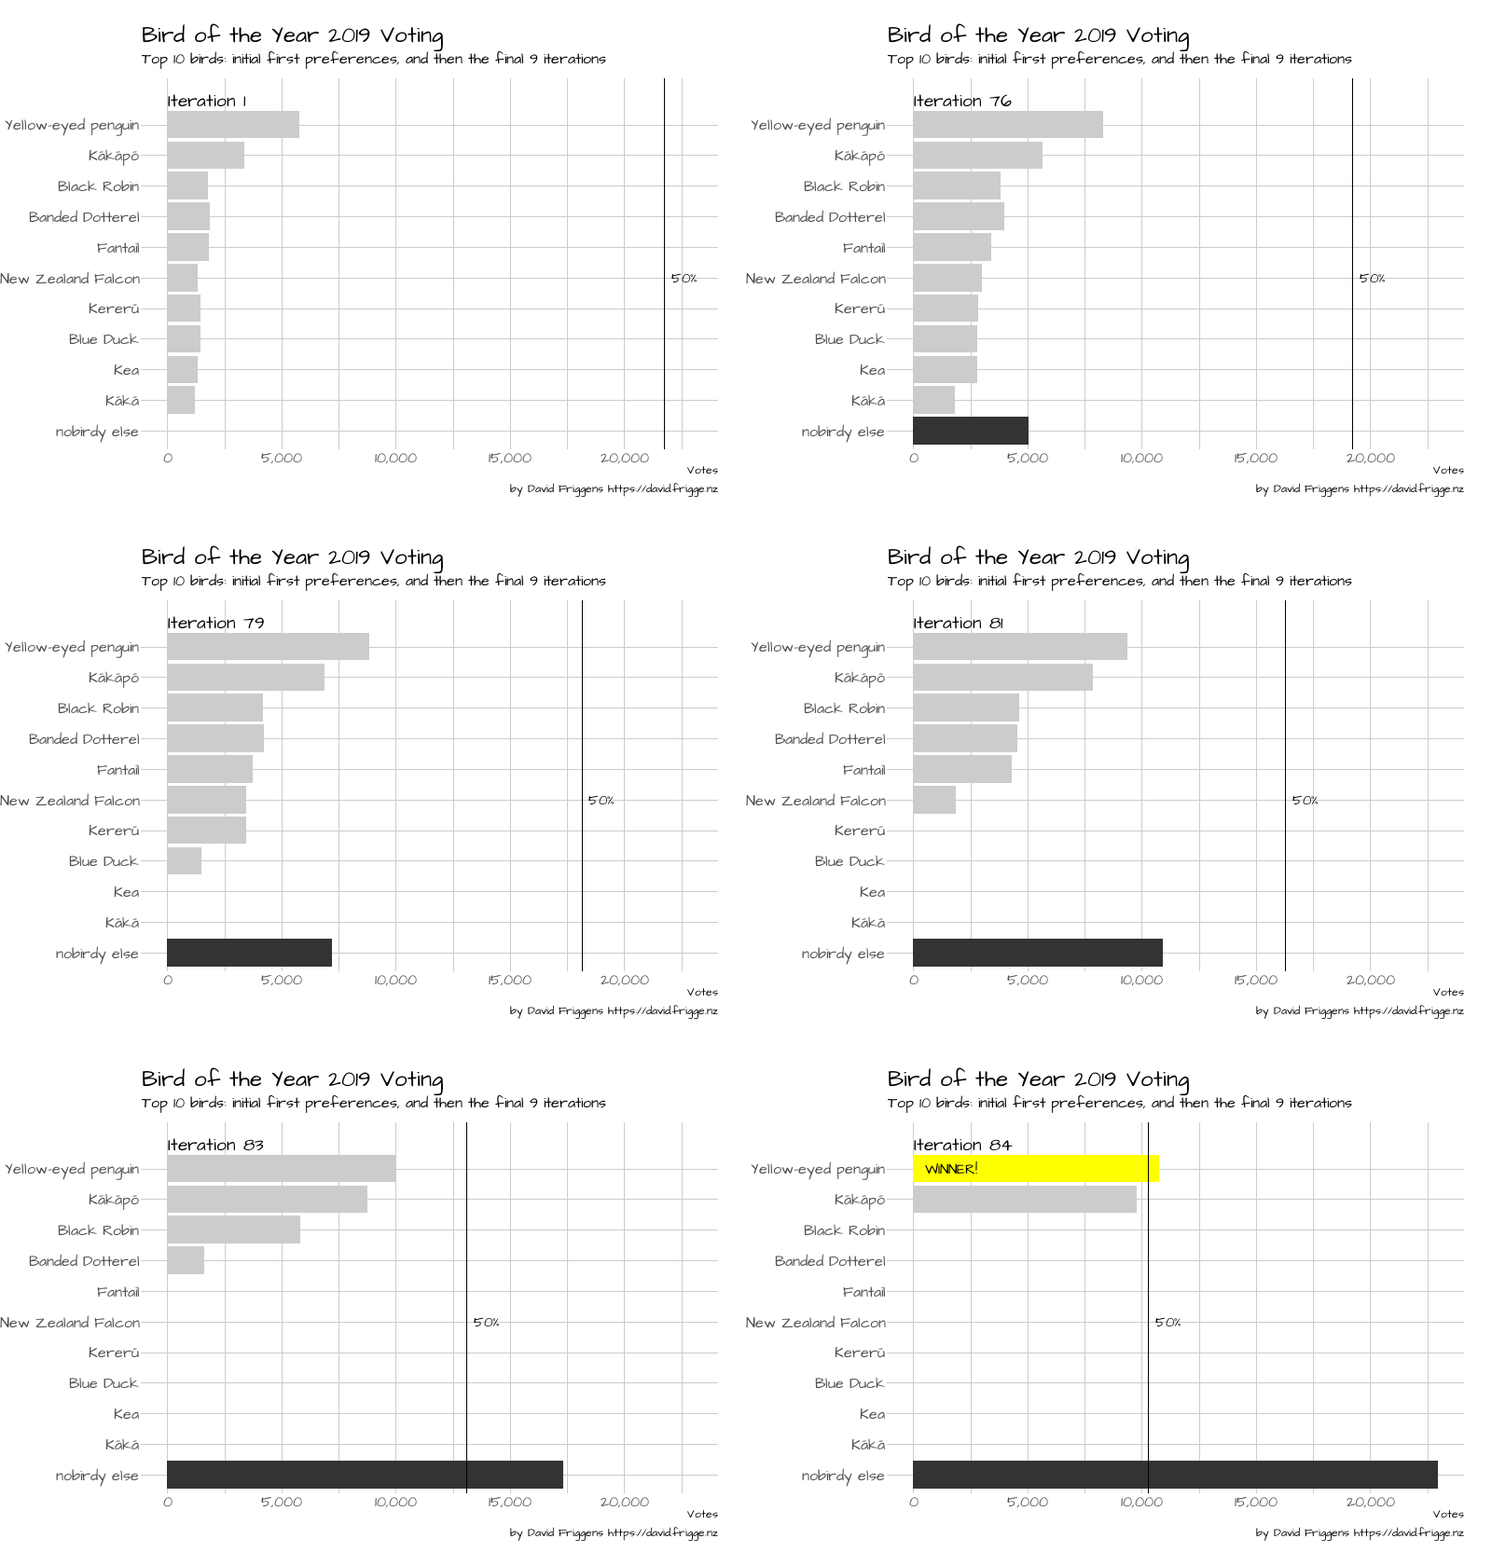
The Yellow-eyed Penguin and the Green-eyed Parrot: Animating voting results
New Zealand birds and their human puppets have been fighting it out for the coveted Bird of the Year title for the 15th time. Here we animate the STV voting using R's `gganimate` package.
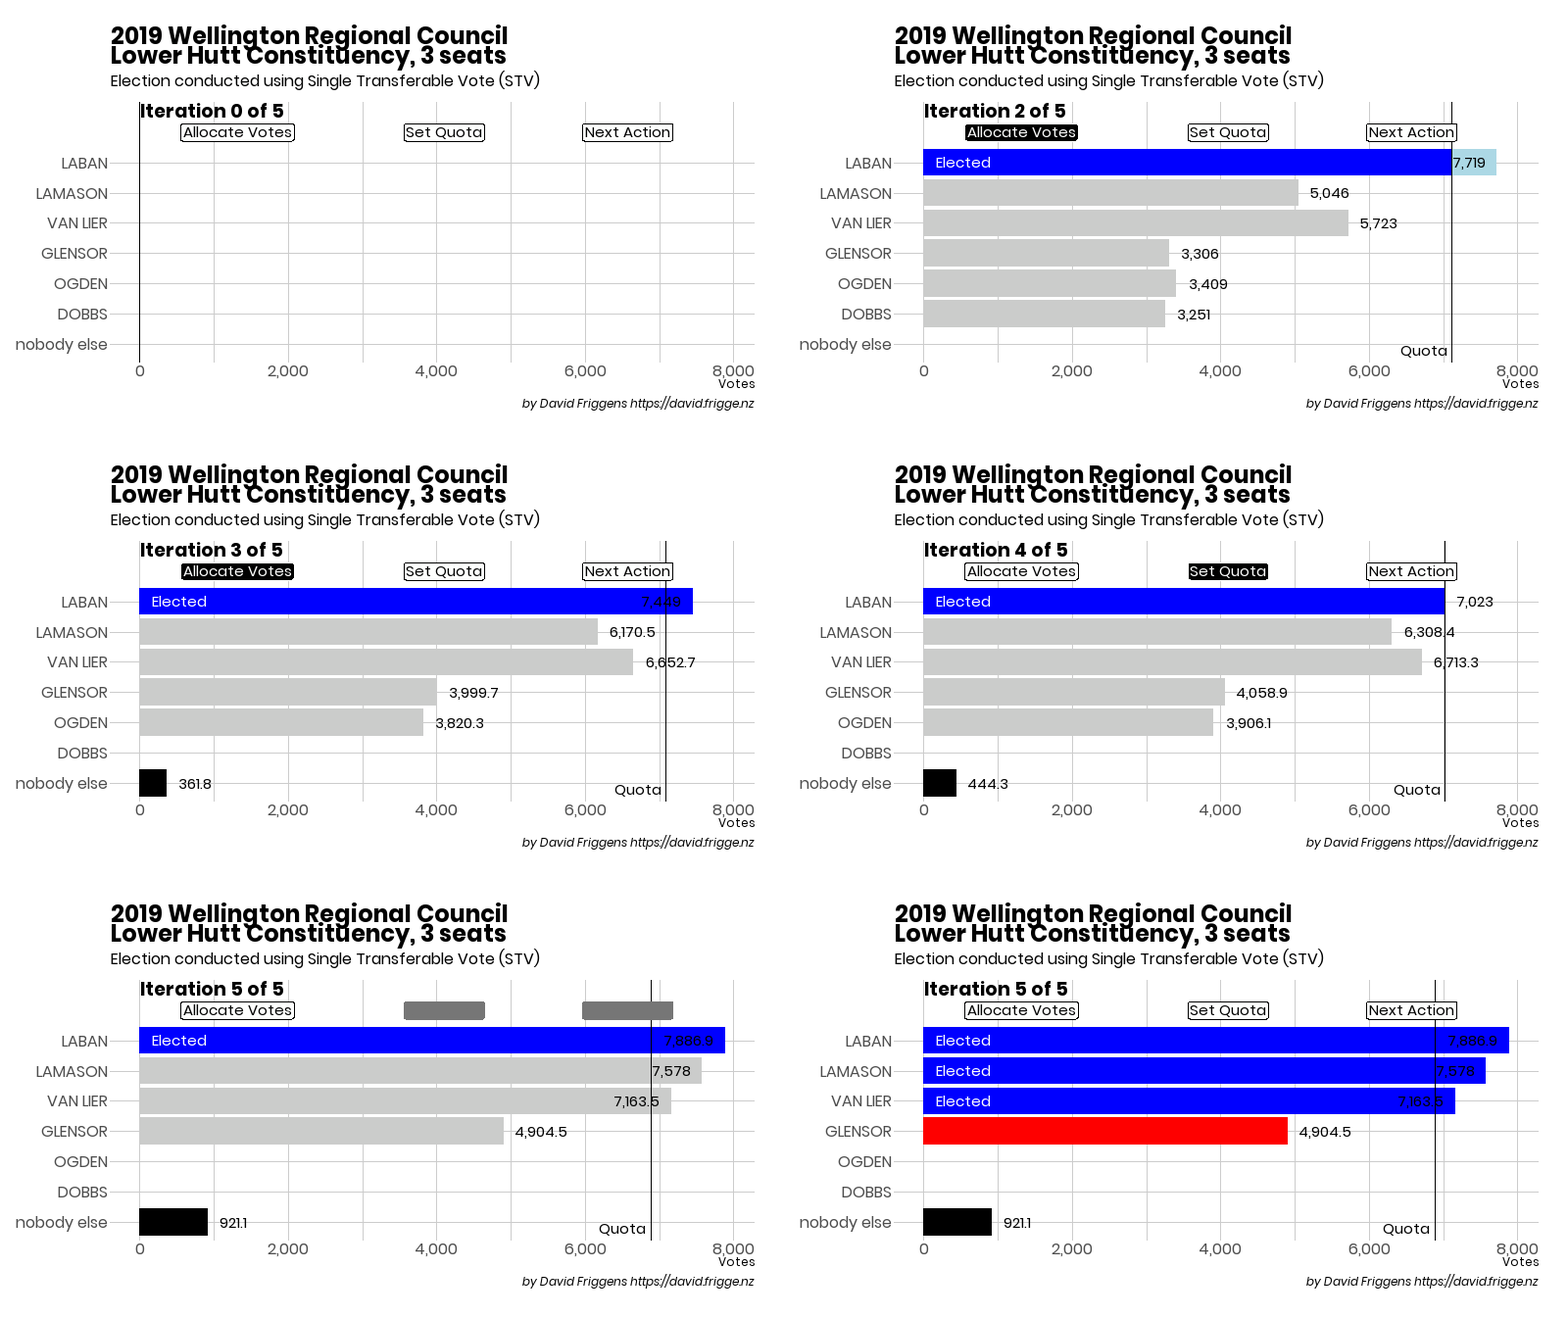
STV Results on the Move
I've made a better go at animating STV election results this time around. Here's a brief announcement/overview.
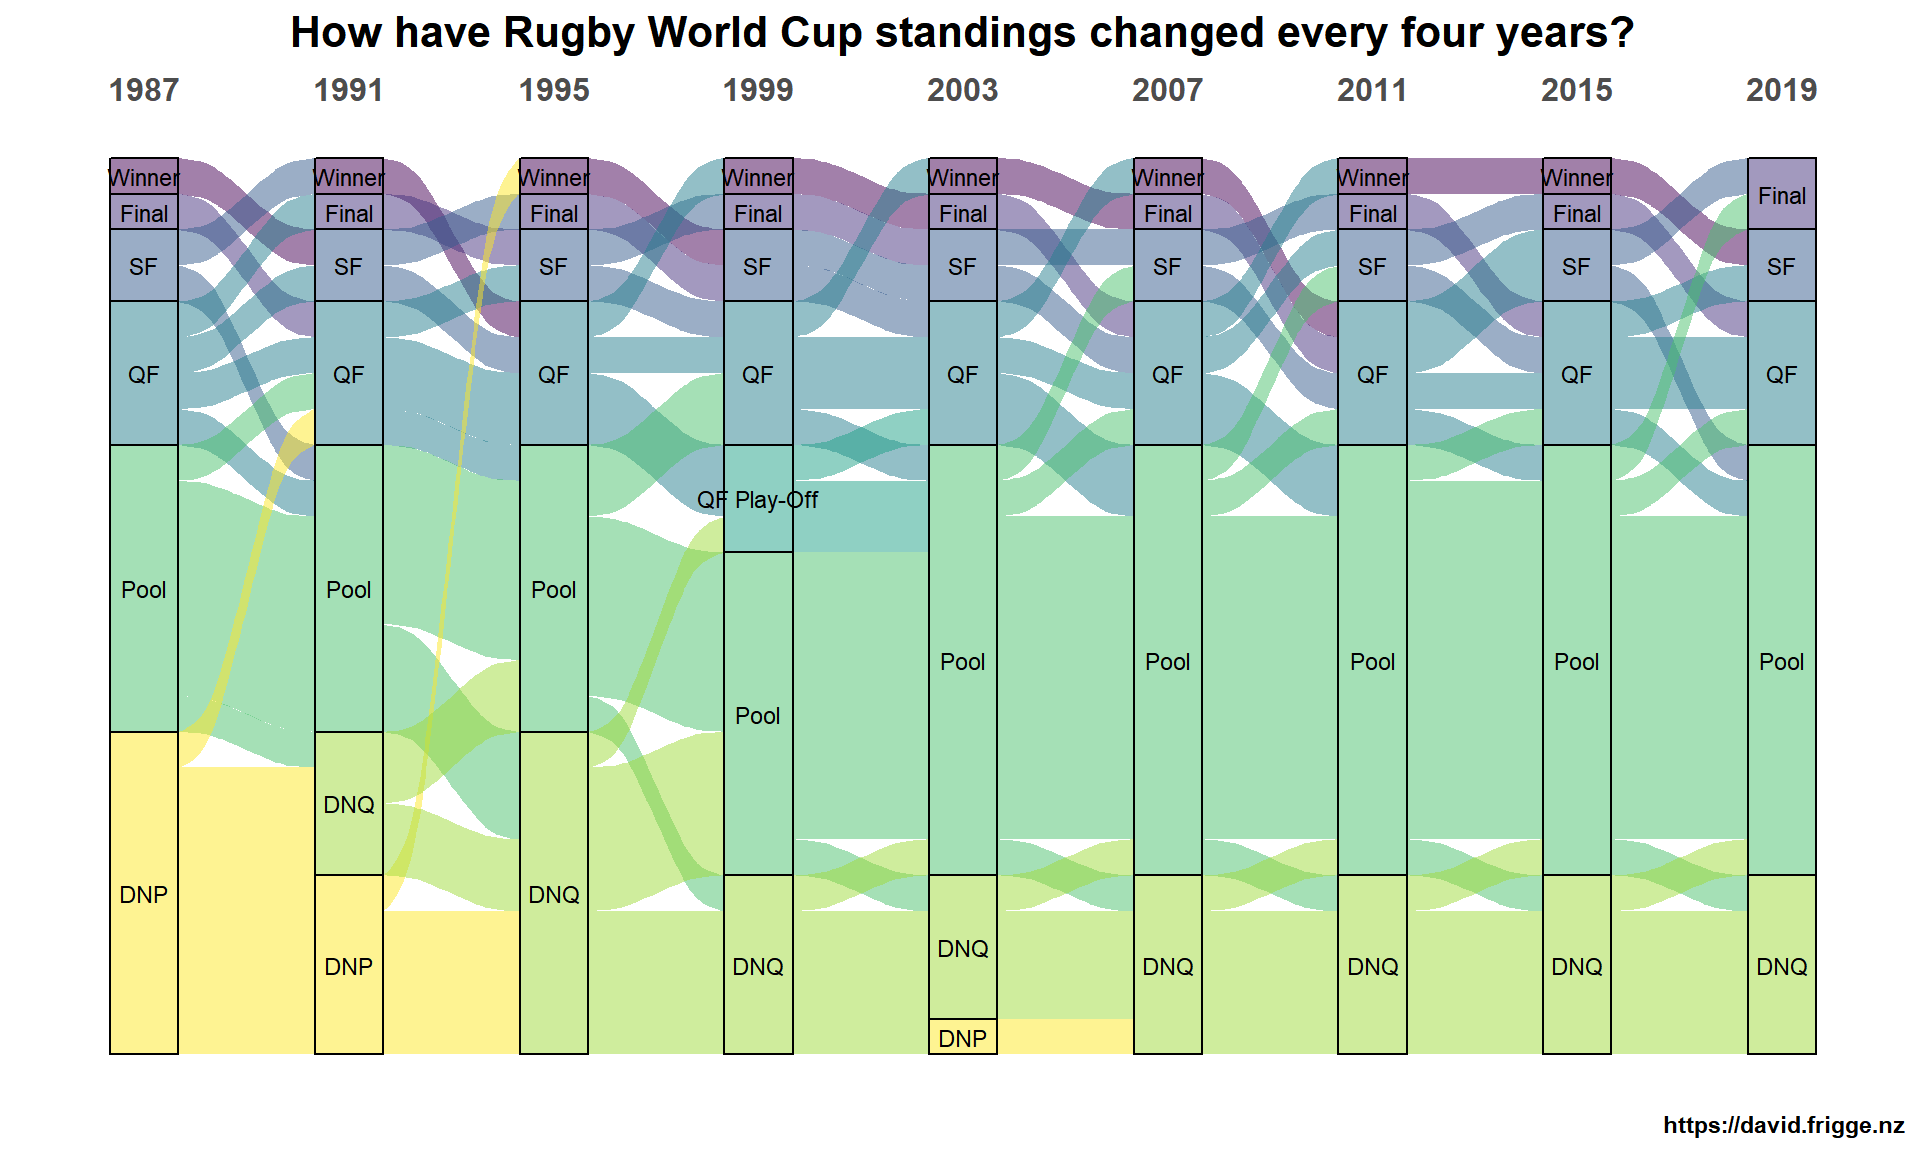
Rugby World Cup Standings
Let's look at the changes in country rankings between each Rugby World Cup using a Sankey / alluvial diagram.

Democracy-in-action
I don't know what I'm more excited about - new election results to pore over, or my first follow-up post! In 2016 I looked at voter turnout in the New Zealand local body elections. Now three years later, almost to the day, let's have a look again and see how things have turned out this year. Is it Democracy In Action or Democracy Inaction?

Comparing Auckland's Population with Maps
I made a map at work comparing Auckland and other New Zealand cities. Let's talk through building something similar, in R.
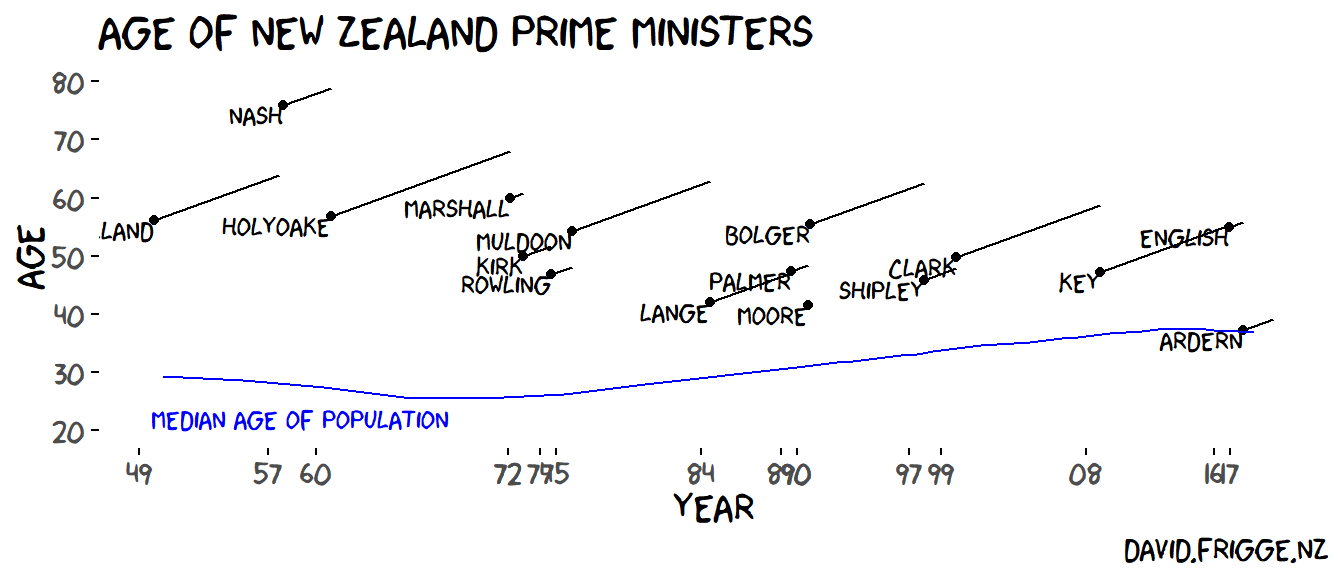
Leaders' Ages
_The Economist_ used some graphs to show "Leaders of Western economies are getting younger, even as their populations age". Naturally my first question was "what about New Zealand?"
A Radixal Approach to Blogging
The blog is dead. Long live the blog! The blog went in to unintentional hiatus as I had enough of handling things manually with RMarkdown. I've converted it to use the new radix package, and written some notes about the process.
Anyone Who Had a Heart
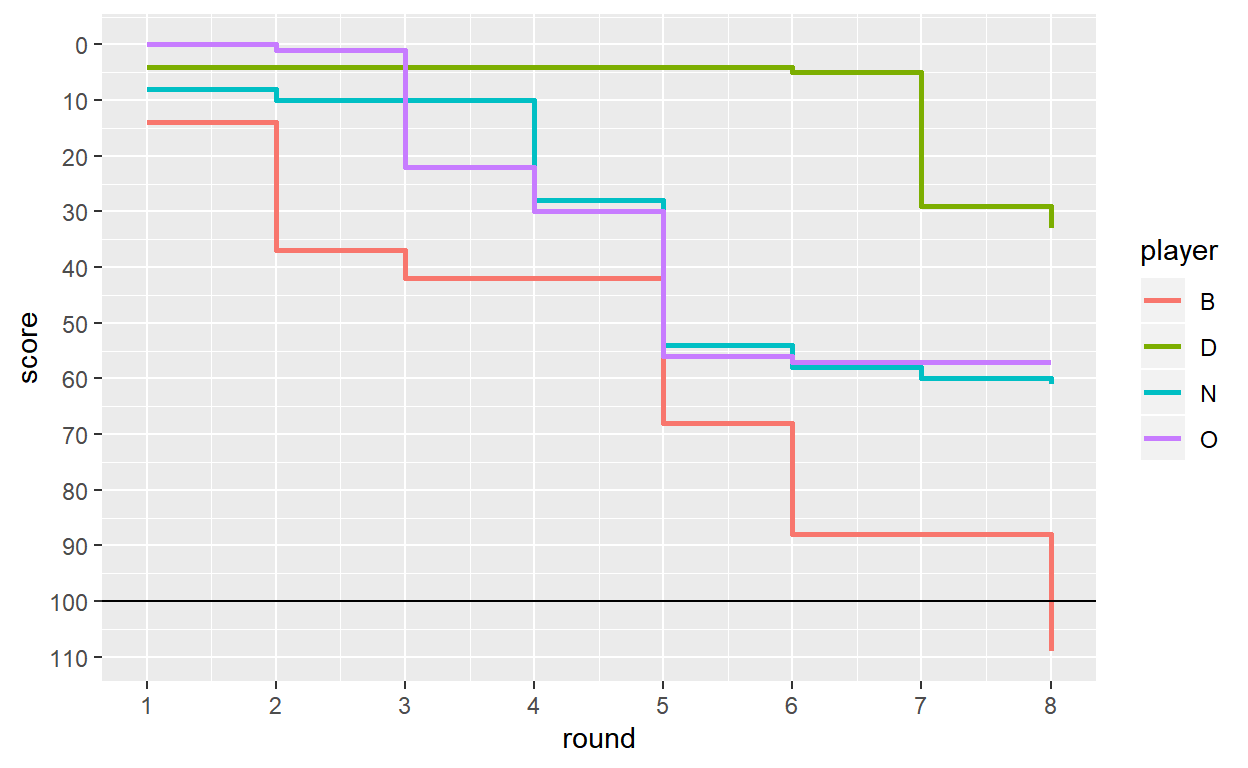
Visualising card game results. Less exciting than it sounds.
Earthquake Excuses
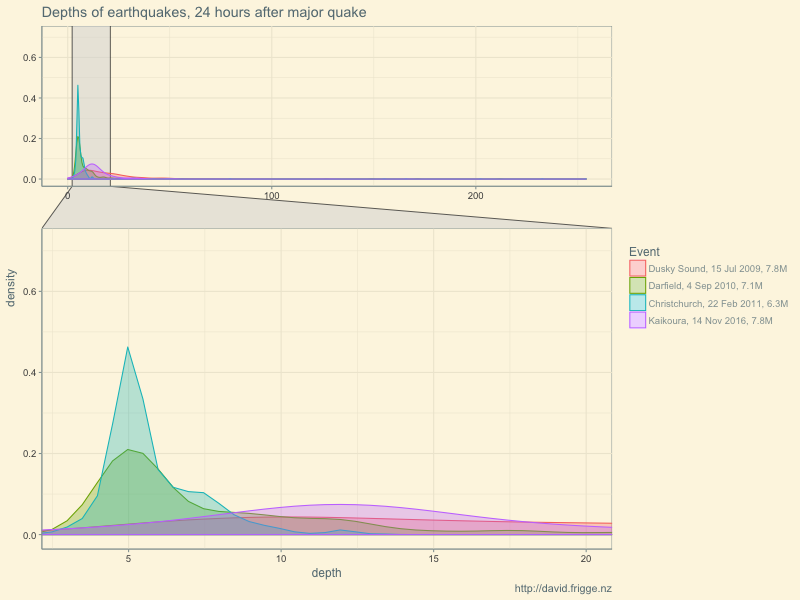
Some visualisation experiments using earthquake data. Facet zooming in ggplot and maps with Plotly. (Why didn't I make these separate posts?)

Election Transparency
Some reflections on trying to find out information about local government elections.
Earthquake Depth
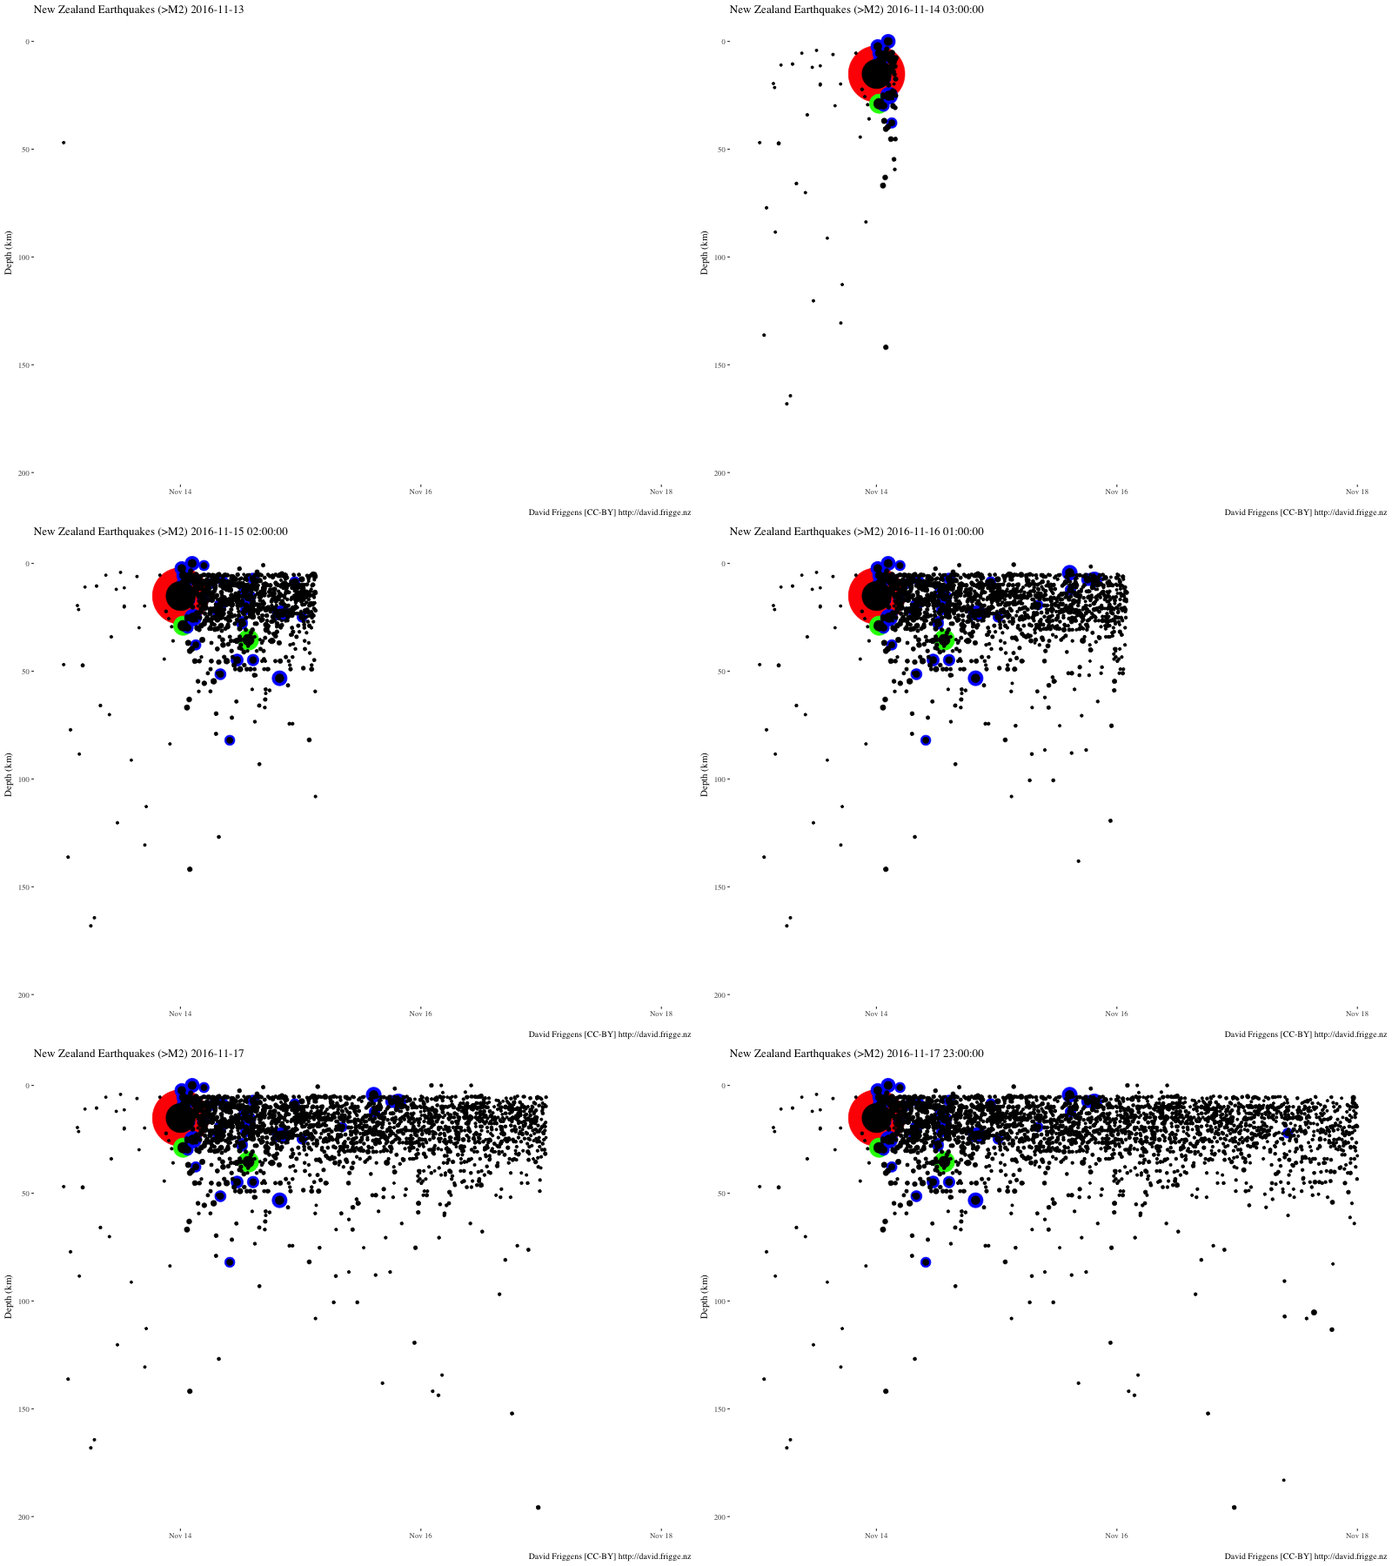
Some visualisations of the depths of the recent New Zealand earthquakes.
Simple To Vote
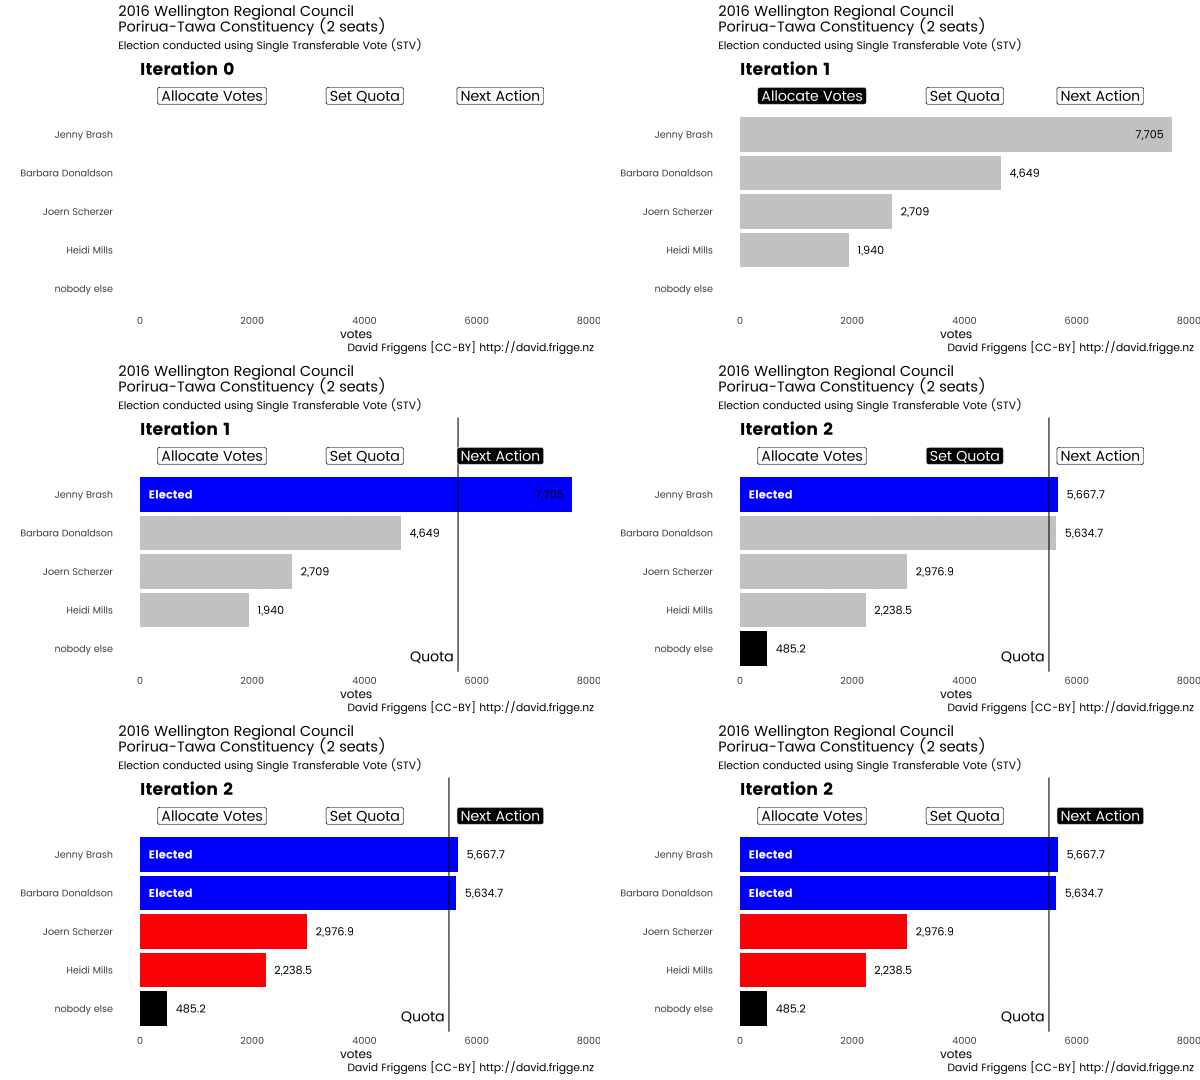
Animations to visualise New Zealand local body elections using STV (Single Transferable Vote).

W[h]ither Local Democracy?
If you live in New Zealand you would have been hard pressed not to notice that we had local body elections recently. It seems that all anyone can talk about is the turnout. Is it all bad news?

The Luminaries
Do the the parts of Eleanor Catton's The Luminaries incrementally reduce by half? (TL;DR - no. There is a method, but it's not that.)

Unfamiliar Maps
Many towns and cities share the same name. Some are less well known than others. Let's take a look.
Birthday Eve
Some time ago I had a thought - if you had a daughter and she was born on Christmas Eve or New Year's Eve, would you be tempted to name her Eve?